Question 1 (2 marks)
Method
Why must the baseline be in pencil and above the solvent?
Show model answer / marking points
Pencil does not readily dissolve/move with solvent (1); spots must start above solvent or wash into it (1).

Separate components of a mixture using paper chromatography and calculate Rf values.
Chromatography is fun and simple to do so you must focus on the process, the key terms involved and calculating the Rf value of a pigment in the food colouring that you are using. Identify the mobile phase, the stationary phase, the solvent, the solute, the solvent front as well as important steps such as why the base line is always drawn in pencil.
Components partition between the stationary phase (paper) and mobile phase (solvent), travelling different distances.
Draw baseline in pencil; keep it above solvent; mark solvent front before drying; measure from baseline.
Chromatography paper
pencil
ruler
beaker
lid
solvent
food colouring samples
capillary tubes or spotting sticks
Collect your equipment: Beaker, wire, chromatography paper, pens provided.
Draw a pencil line across the paper approximately 1cm up
Draw spots of the ink onto the pencil line
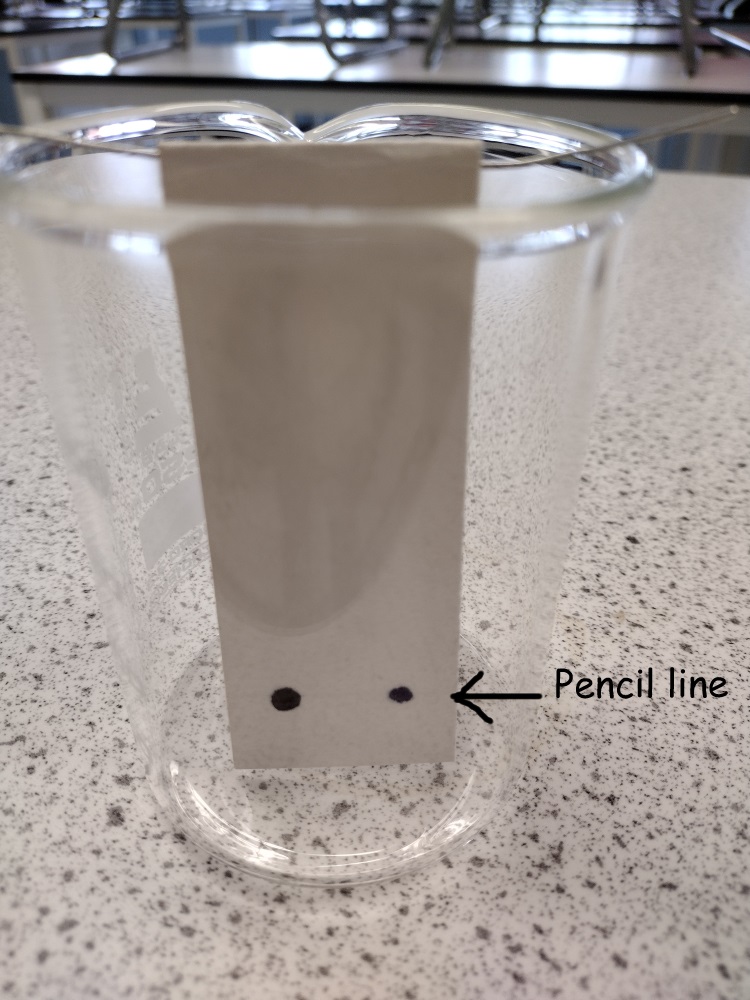
Carefully add water so that it touches the paper but does not touch the in spots.
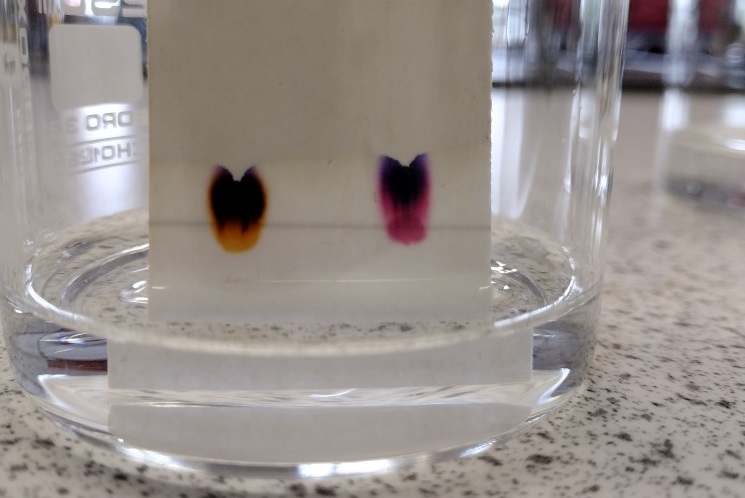
Wait for the water to rise towards the top of the paper then remove it from the water.
Carefully mark the height that the water reached (solvent front)
Work out the Rf value for a particular pigment that did not reach the solvent front.
| Type of variable | What is measured or controlled? |
|---|---|
| Independent variable | Solvent or sample investigated |
| Dependent variable | Distances travelled by spots and Rf values |
| Control variables | Paper type; solvent depth; origin position; solvent system; run time |
Follow your teacher's instructions and your school's risk assessment. This page is not a substitute for a formal risk assessment.
| Hazard | Risk | Precaution |
|---|---|---|
Chromatography solvents |
Flammable vapour or irritation depending on solvent |
Prefer approved water-based solvents where suitable; keep flammable solvents away from ignition sources. |
Measure baseline-to-spot distances and baseline-to-solvent-front distance; sketch chromatogram and label spots.
Rf = distance moved by substance ÷ distance moved by solvent front.
Different substances can travel different distances; identical Rf in one solvent is supporting, not conclusive, evidence of identity.
Use small concentrated spots, repeat in a second solvent and keep chamber covered where appropriate.
Rf values are measured from the pencil baseline and have no units; compare values only under matching chromatographic conditions.
The solvent front is the furthest point reached by the solvent, not by the pigment.
Answer each question in full before opening the model answer. Check your work against the marking points and look for scientific key words.
Method
Why must the baseline be in pencil and above the solvent?
Pencil does not readily dissolve/move with solvent (1); spots must start above solvent or wash into it (1).
Calculation
Spot travels 3.6 cm; solvent front travels 6.0 cm. Calculate Rf.
Rf = 3.6 ÷ 6.0 = 0.60 (2).
Analysis
Why do dyes separate on chromatography paper?
They differ in affinity/solubility in mobile and stationary phases (2).
Evaluation
Suggest one improvement to make the investigation more reliable and explain why it helps.
Repeat measurements and calculate a mean (1), reducing the influence of random variation/anomalies (1). Alternative valid improvement specific to the experiment with explanation can gain both marks.
This page was updated on: 18th June 2026