
AS - Kinetics
Key learning for this topic
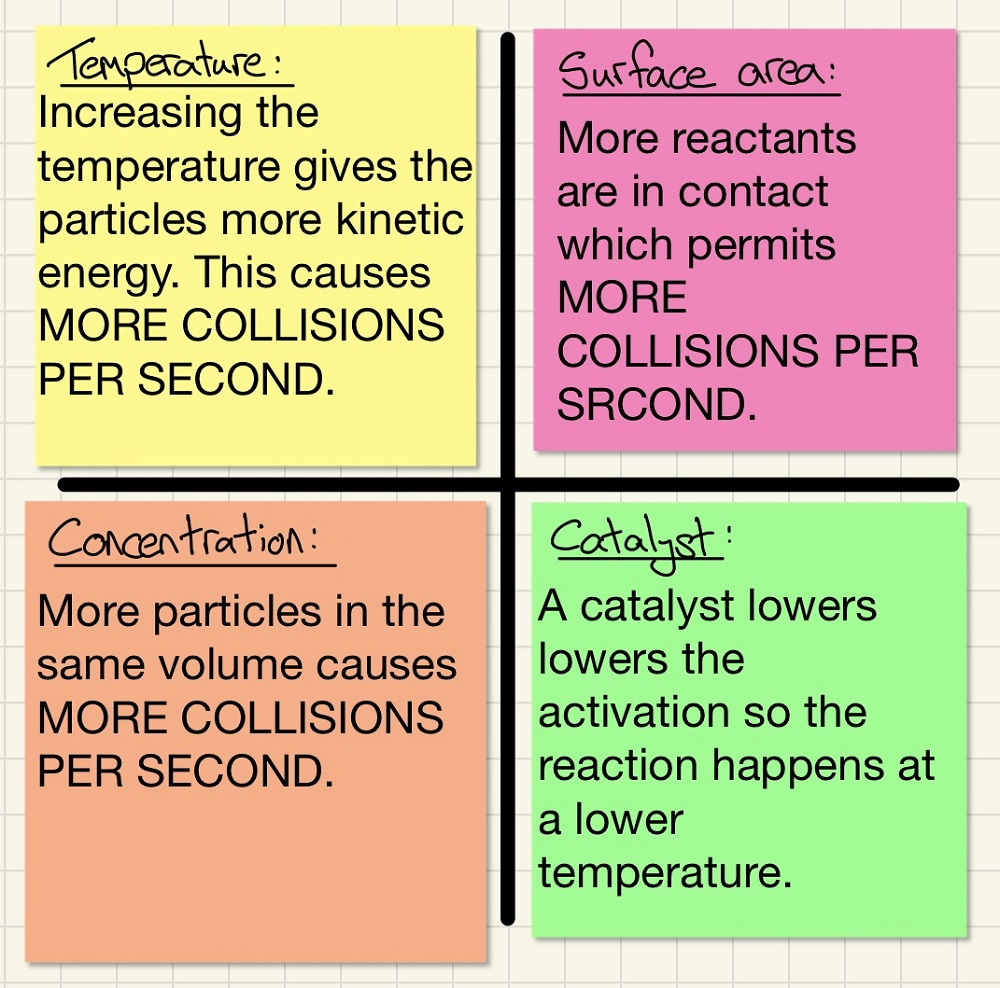
As with most of these topics, remember that you were taught lots of fundamental ideas at GCSE, read through everything that you did to ensure that you fully understand these before we expand on these for A-Level.
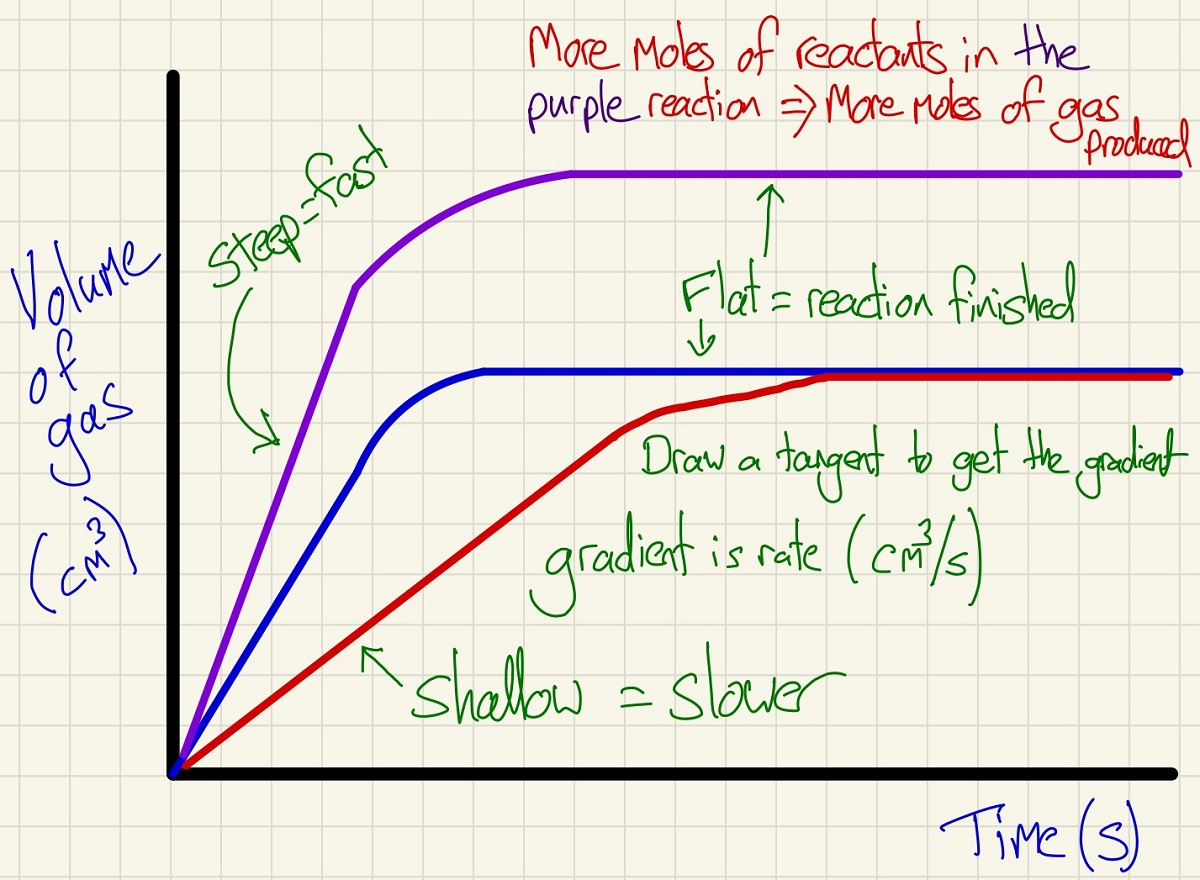
We can measure the rate of reaction (continuous method) by plotting the volume of a gas evolved against the time as shown below. These graphs are simple but show lots of information. By drawing a tangent at different points, you can get the gradient and so the rate. You will be able to see that the rate always falls over time, this is because with time, reactants are used up and so the concentration falls, so does the rate as there are fewer (successful) collision per second. We stipulate "successful" collisions because if the particles do not have the activation energy or higher, they will not react. As well as the rate, you can see the final volume of gas, use PV=nRT to work out the moles of gas and can even see if there was a limiting reactant.
The Maxwell-Boltzmann distribution curves show the amount of (kinetic) energy that molecules in a closed system have. The curve shows you the Emp or Energy most probable and the Ea Activation energy. Only the molecules above the activation energy will have a successful collision and react if they collide with the other reactant molecule type. These curves are a great way to show the effects of changing the temperature and to explain how this affects the rate. In particular, note the shaded areas which clearly show that as the temperature increases, more particles have the activation energy and by cooling it down, far fewer have it and so the numbers of successful collisions per second can be explained clearly.
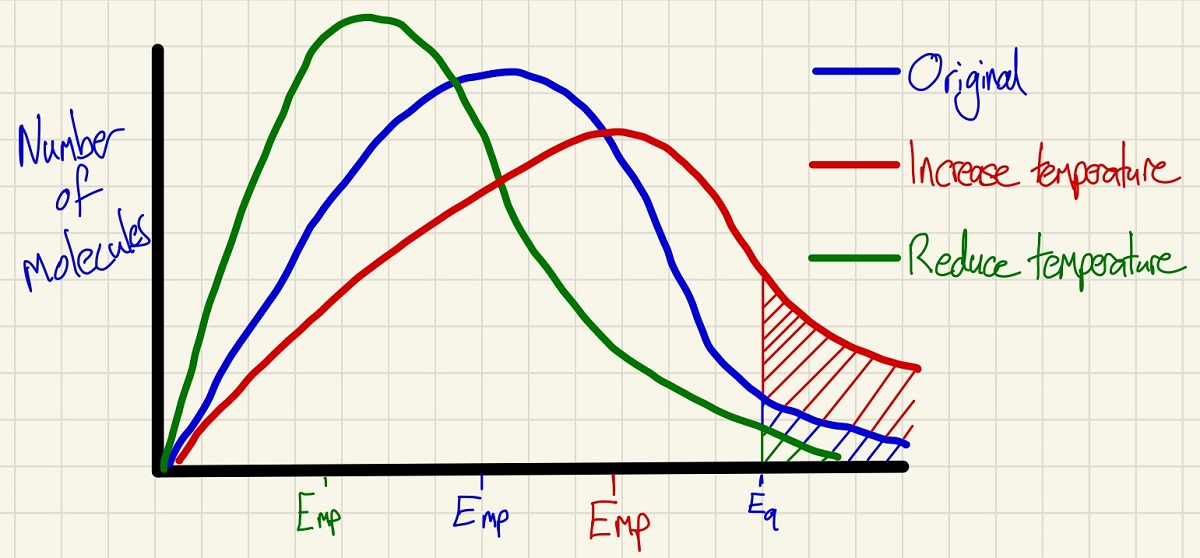
Note that the area under each of the three curves above is identical as we have not changed the number of molecules in any of them, we have simply changed the energy that these molecules possess.

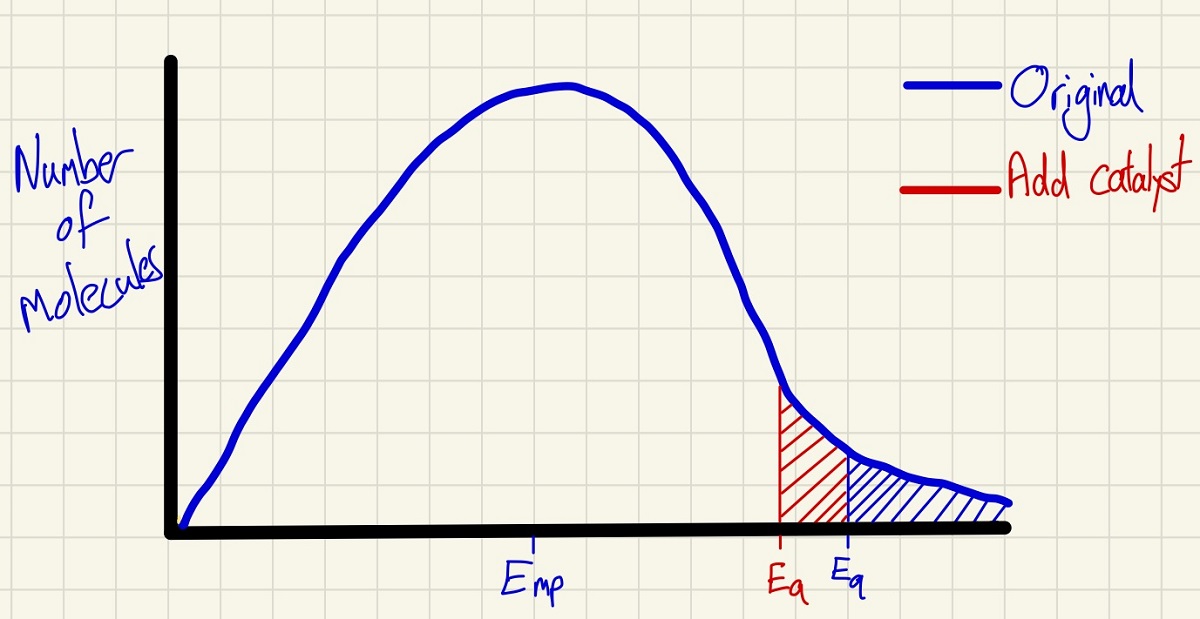
These curves also explain the effect of adding a catalyst. Crucially, the shape of the curve does not change at all which corrects many misconceptions. By moving the minimum energy required to successfully collide to a lower point, the shaded area shows that more molecules have the activation energy so there will be more successful collisions per second and so a higher rate.
In these curves, you can also show if the volume of this systems is reduced (no change as the temperature is constant). Also, if you halve the number of molecules, the curve at every point will simply have half of the height (as a mean distribution of molecules taken will take half from each energy point).
This page was updated on: 8th November 2023